This system uses 2 technical indicators to show you when
you should enter and exit a trade.
These are called
1-Macd 12
,26 ,9
2-the Exponential Moving Average 7, 21
and 50.
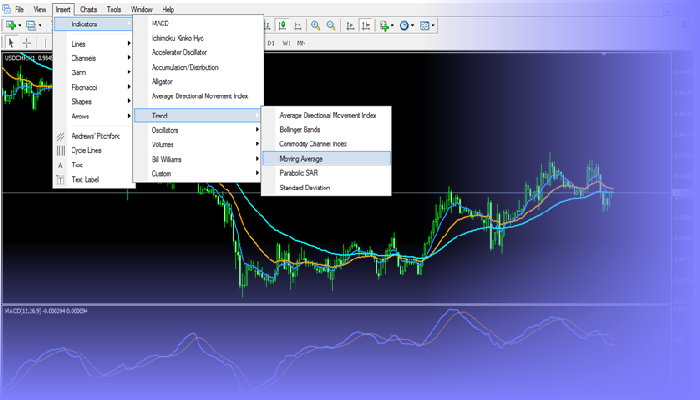
Setup a 60 minute USD/CHF chart.
You can choose any major pair you like
though.

Insert Moving average


When to ENTER a trade
when the EMA 7 crosses the 21 and the 50.
If the 7 crosses the 21 and 50 up from the bottom, and the macd in buy
you enter your trade ‘long’ and ‘buy.
If the 7 cross the 21 and 50 down from the top
and the macd in sell
you go ‘short’ and ‘sell’.

In the example above, there was a great opportunity to go long on
the USD/CHF pair,
where I circled and labeled enter. Notice how the EMA 7 crossed up the 21 and 50
and the macd in buy.
*If you are trading the hour charts like in the above example, make sure that the
15 min charts macd is going the same way.

When to EXIT a trade
The best time to exit a trade is when
the price crosses back down through all 3 EMA’s on the chart.

Where to Set the Stop Loss
When you open a demo account you will
find on the online trading platform that you will always be able to enter a stop
order
level that will automatically stop out
your trade at the level you set, or a limit order that will close your position
at your desired
profit level.
You should always set your level just
below the EMA 50. As your position moves
in the right
direction, you should move your stop
accordingly.
Then if your position moves against you,
you would have locked in your profits by
moving up your stop order.
It is important that if the prices cross
back over the 7, 21 and 50 that you close your position
No comments:
Post a Comment